


Many factors influence the unemployment rate, and vacancies are just one. Thus, to understand how a lower vacancy rate would influence unemployment going forward, we need to separate the direct effect of vacancies on the unemployment rate from other factors. To do that, we first need to review the factors that account for unemployment movements.
There are two broad determinants of unemployment: separations from employment (including layoffs and quits), which raise unemployment, and job finding by the unemployed, which lowers unemployment.2 Separations consist largely of layoffs, which are typically cyclical, surging in recessions and falling during booms. Job finding is also highly cyclical, rising as the labor market tightens and falling in recessions.
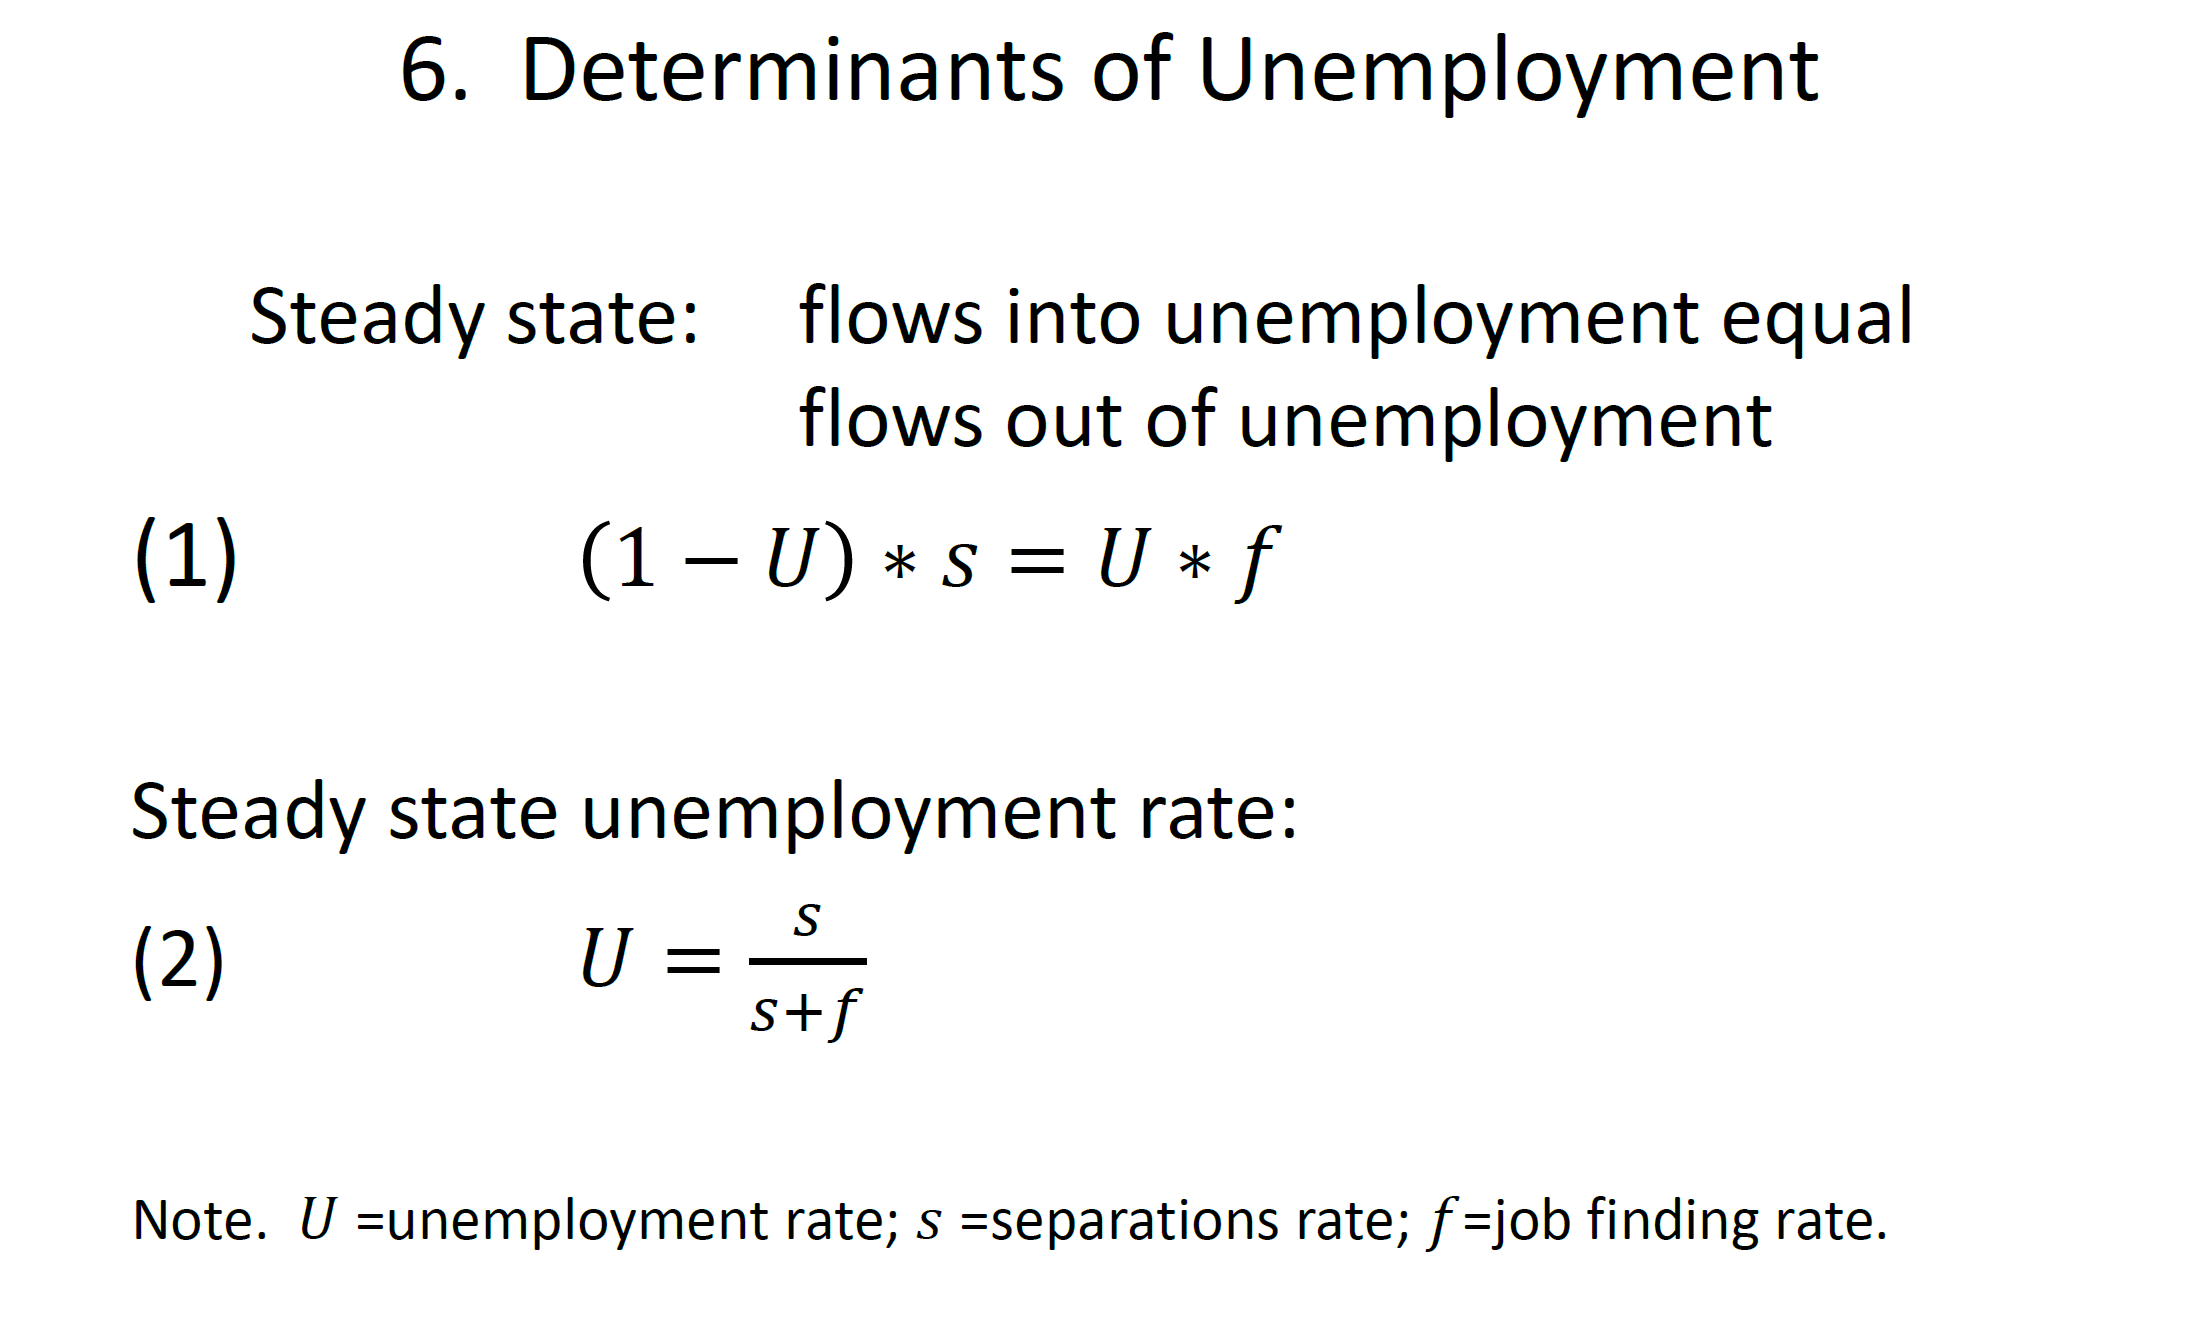
To see how separations and job finding affect the unemployment rate, it's helpful to start with equation (1) on slide 6, which states that in a steady state (that is, when the unemployment rate is constant), flows into unemployment, the left side of equation (1), must equal flows out of unemployment, the right side. Flows into unemployment equal the separations rate, ss, times the level of employment. For simplicity, I've normalized the labor force to 1, so that employment equals 1 minus unemployment, UU. Flows out of unemployment, the right side of the equation, equal the rate of job finding, ff, times the number of unemployed. Rearranging this equation yields an expression for the steady-state unemployment rate, equation (2).3 Because flows into and out of unemployment are quite high, the actual unemployment rate converges to the steady-state unemployment rate quickly, and the steady-state unemployment rate typically tracks the actual rate closely.4 So, going forward, I'm going to think of the steady-state unemployment rate as a good approximation of the actual unemployment rate.
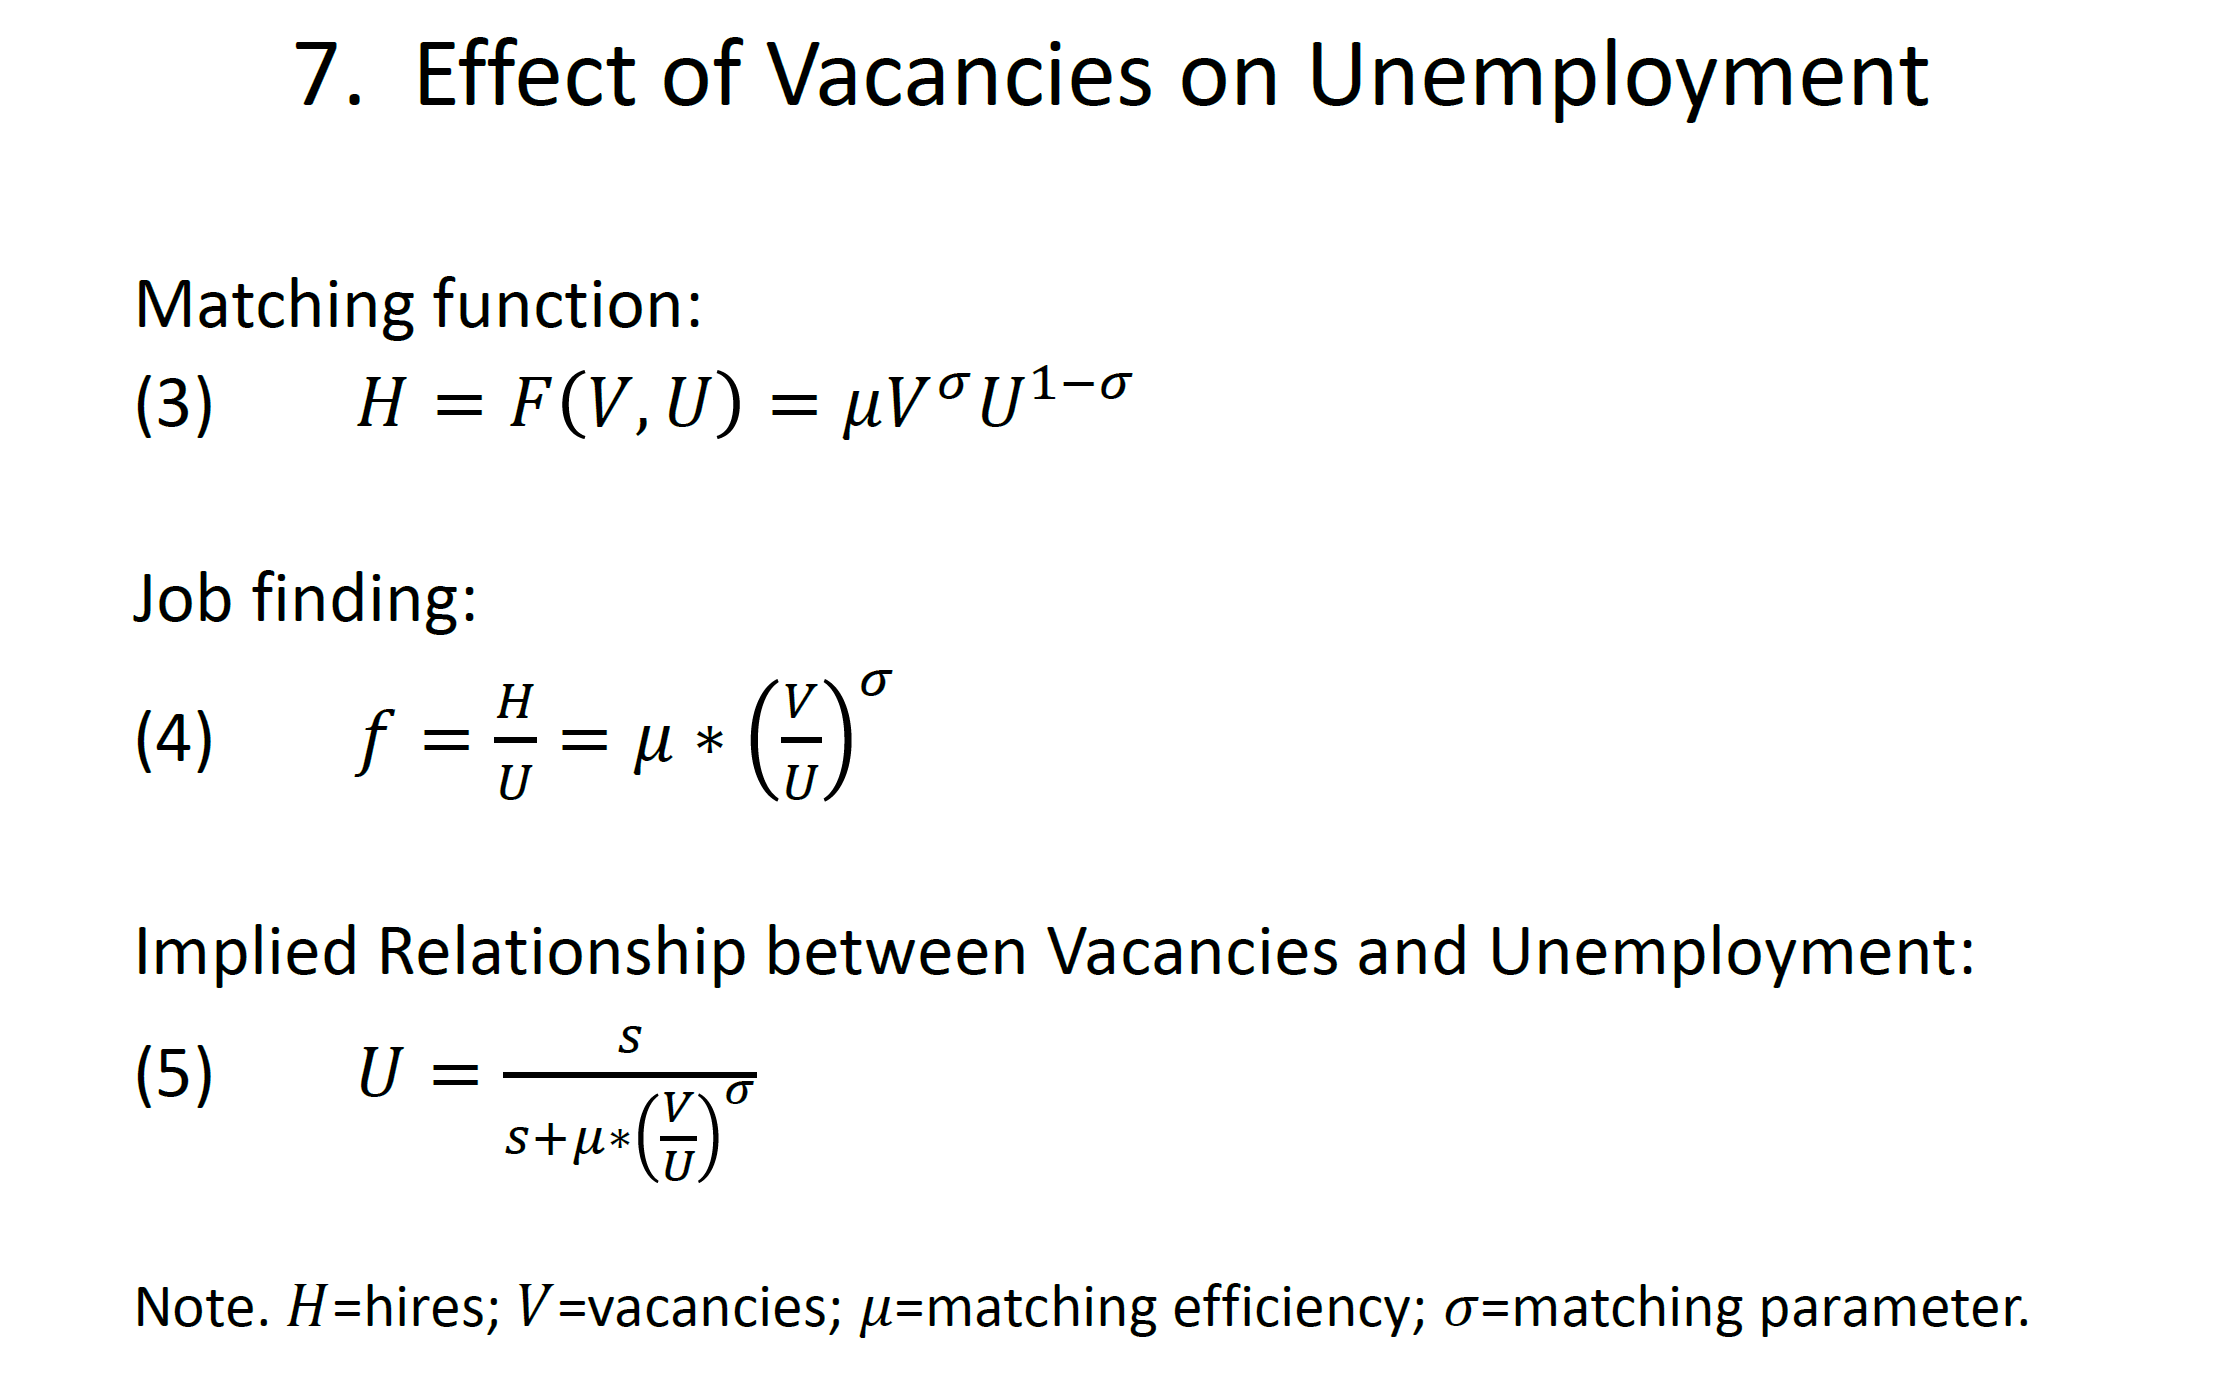
Now let me focus on job finding, which is often thought to depend on the number of job vacancies relative to the number of unemployed workers. To see why, start with equation (3) on slide 7, which states that the number of hires is an increasing function of both the number of job vacancies and the number of unemployed individuals searching for jobs: The more firms there are looking for workers and the more workers there are looking for jobs, the more matches, or hires, there will be. For convenience, I'm assuming a mathematical representation of this matching function takes a Cobb-Douglas form. If we divide both sides of equation (3) by unemployment, we get equation (4), which expresses the job-finding rate as a function of the ratio of vacancies to unemployment, or labor market tightness.
Because we have data for both the left and right sides of equation (4), we can estimate it and obtain parameter values for the elasticity of job finding with respect to labor market tightness, sigma, and matching efficiency, mu.5 Matching efficiency represents factors that can increase (or decrease) job findings without changes in labor market tightness. On the one hand, if the workers searching for jobs are well suited for the jobs that are available, matching efficiency will be high; on the other hand, if many searching workers are not well suited for the available jobs, matching efficiency will be low.6
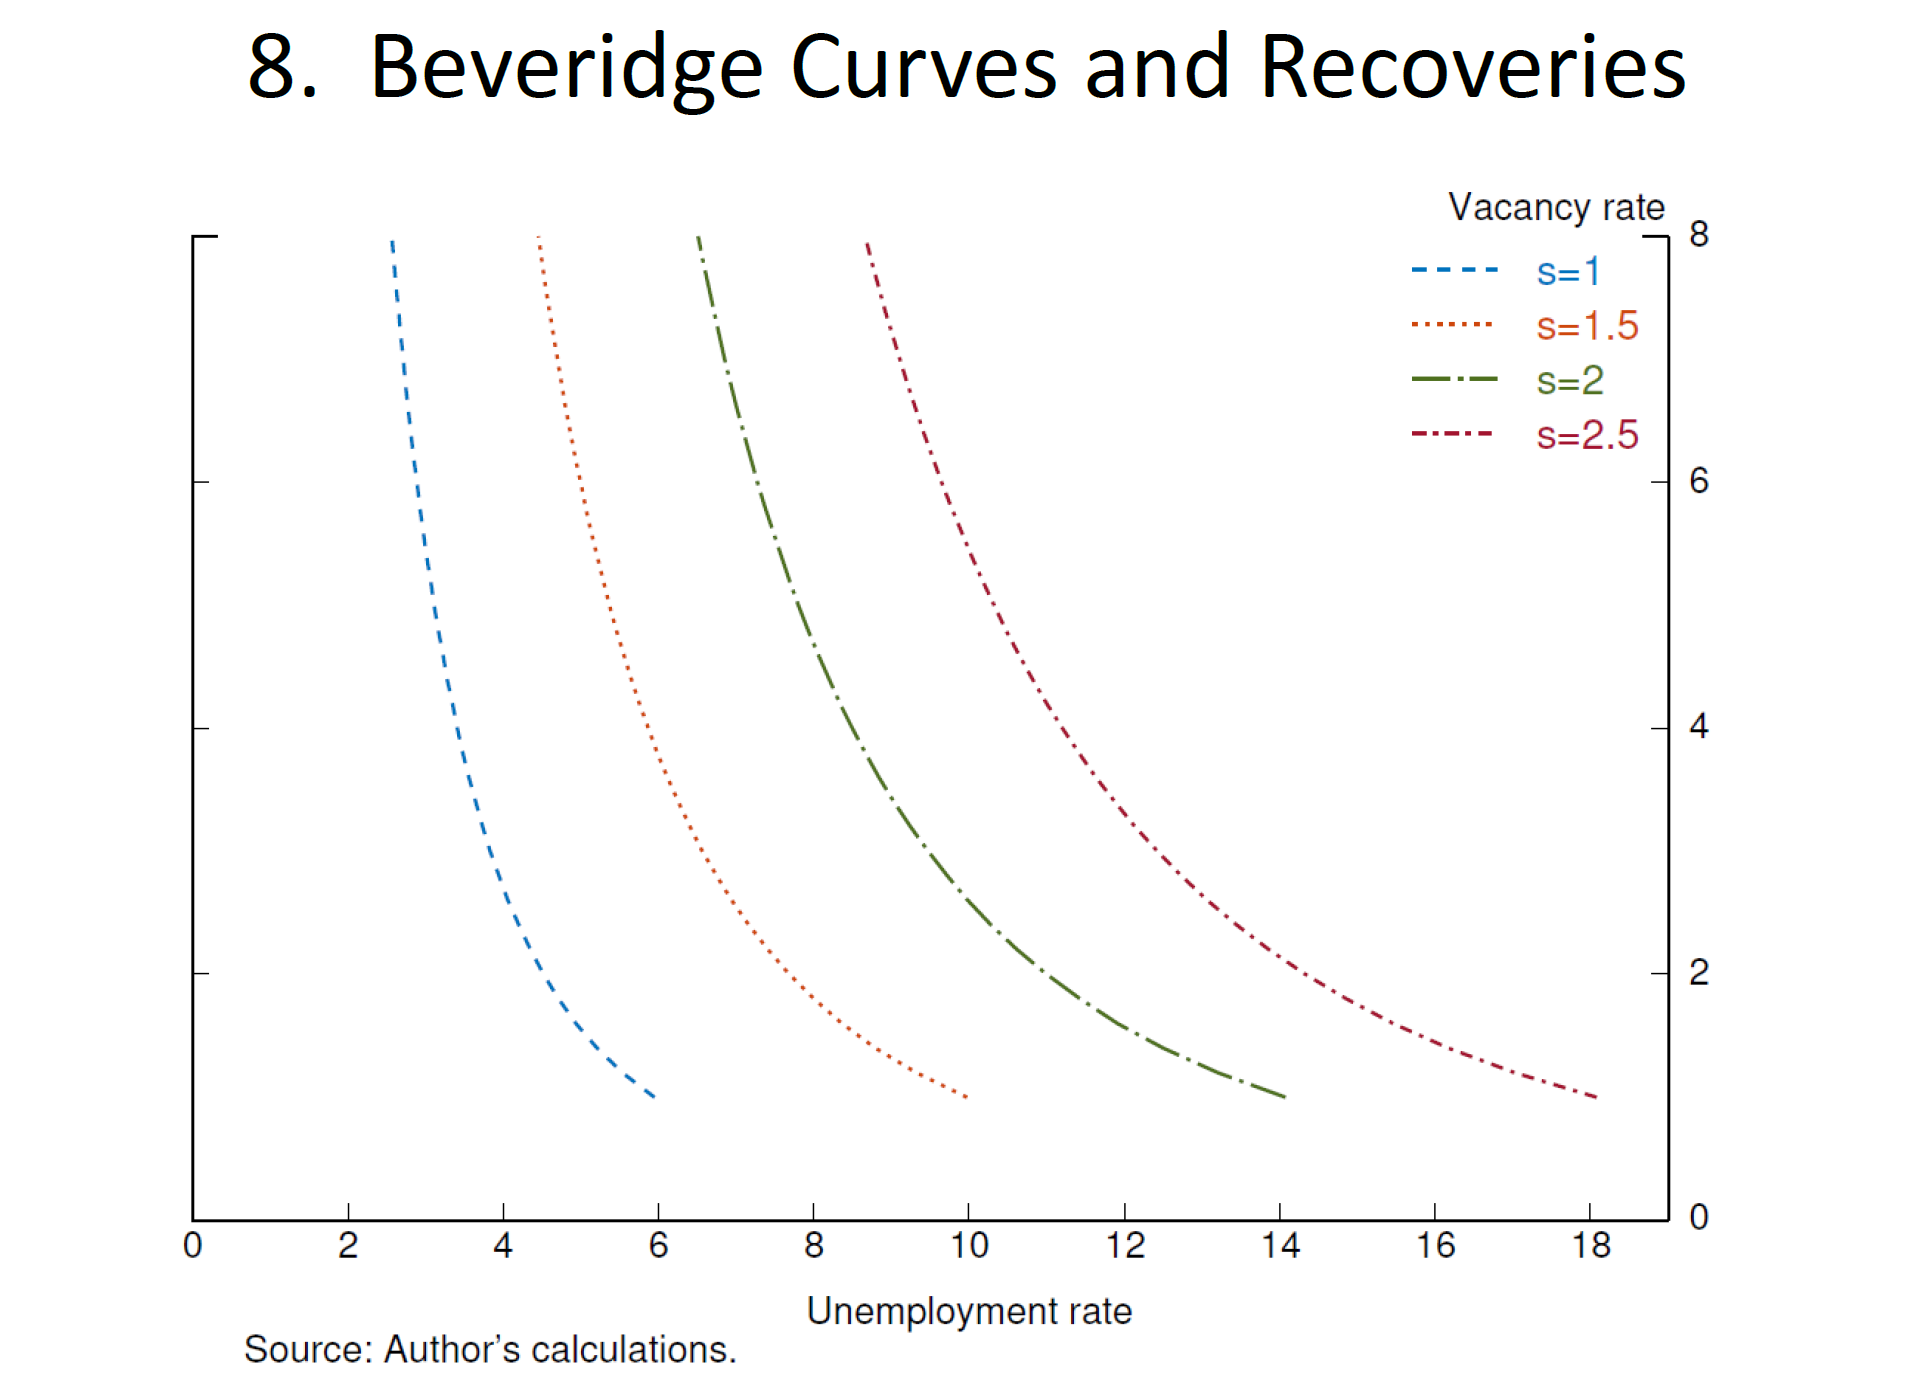
The last step is to plug our expression for job finding into equation (2), the steady-state unemployment rate, yielding equation (5). Equation (5) shows how vacancies affect the unemployment rate. To illustrate this relationship, I solve equation (5) for different values of VV and ss, holding the matching efficiency parameters constant. That is, I pick a separation rate at some level and trace out what happens to the unemployment rate as the vacancy rate changes. Then I pick a different separation rate and again trace out the effect of vacancies on unemployment. The result is shown on slide 8, which plots four curves showing the effect of vacancies on unemployment for four different separation rates. Each curve is convex; as the number of vacancies increases relative to the number of individuals looking for work, it becomes harder for firms to fill jobs with suitable workers, and more jobs remain vacant. This is exactly the situation many employers are now experiencing. Because more vacancies generate fewer and fewer hires, they result in smaller and smaller reductions in unemployment. But large numbers of vacancies are, of course, a hallmark of tight labor markets and additional vacancies continue to strongly boost wage growth and quits.
The curve farthest to the right, labeled s=2.5, represents a situation when the separations rate is 2.5 percent, a historically high level. This rate is approximately the level seen in the middle of 2020, just after the onset of the pandemic. You can see that when the separations rate is this high, the unemployment rate is also going to be high, no matter the level of vacancies.
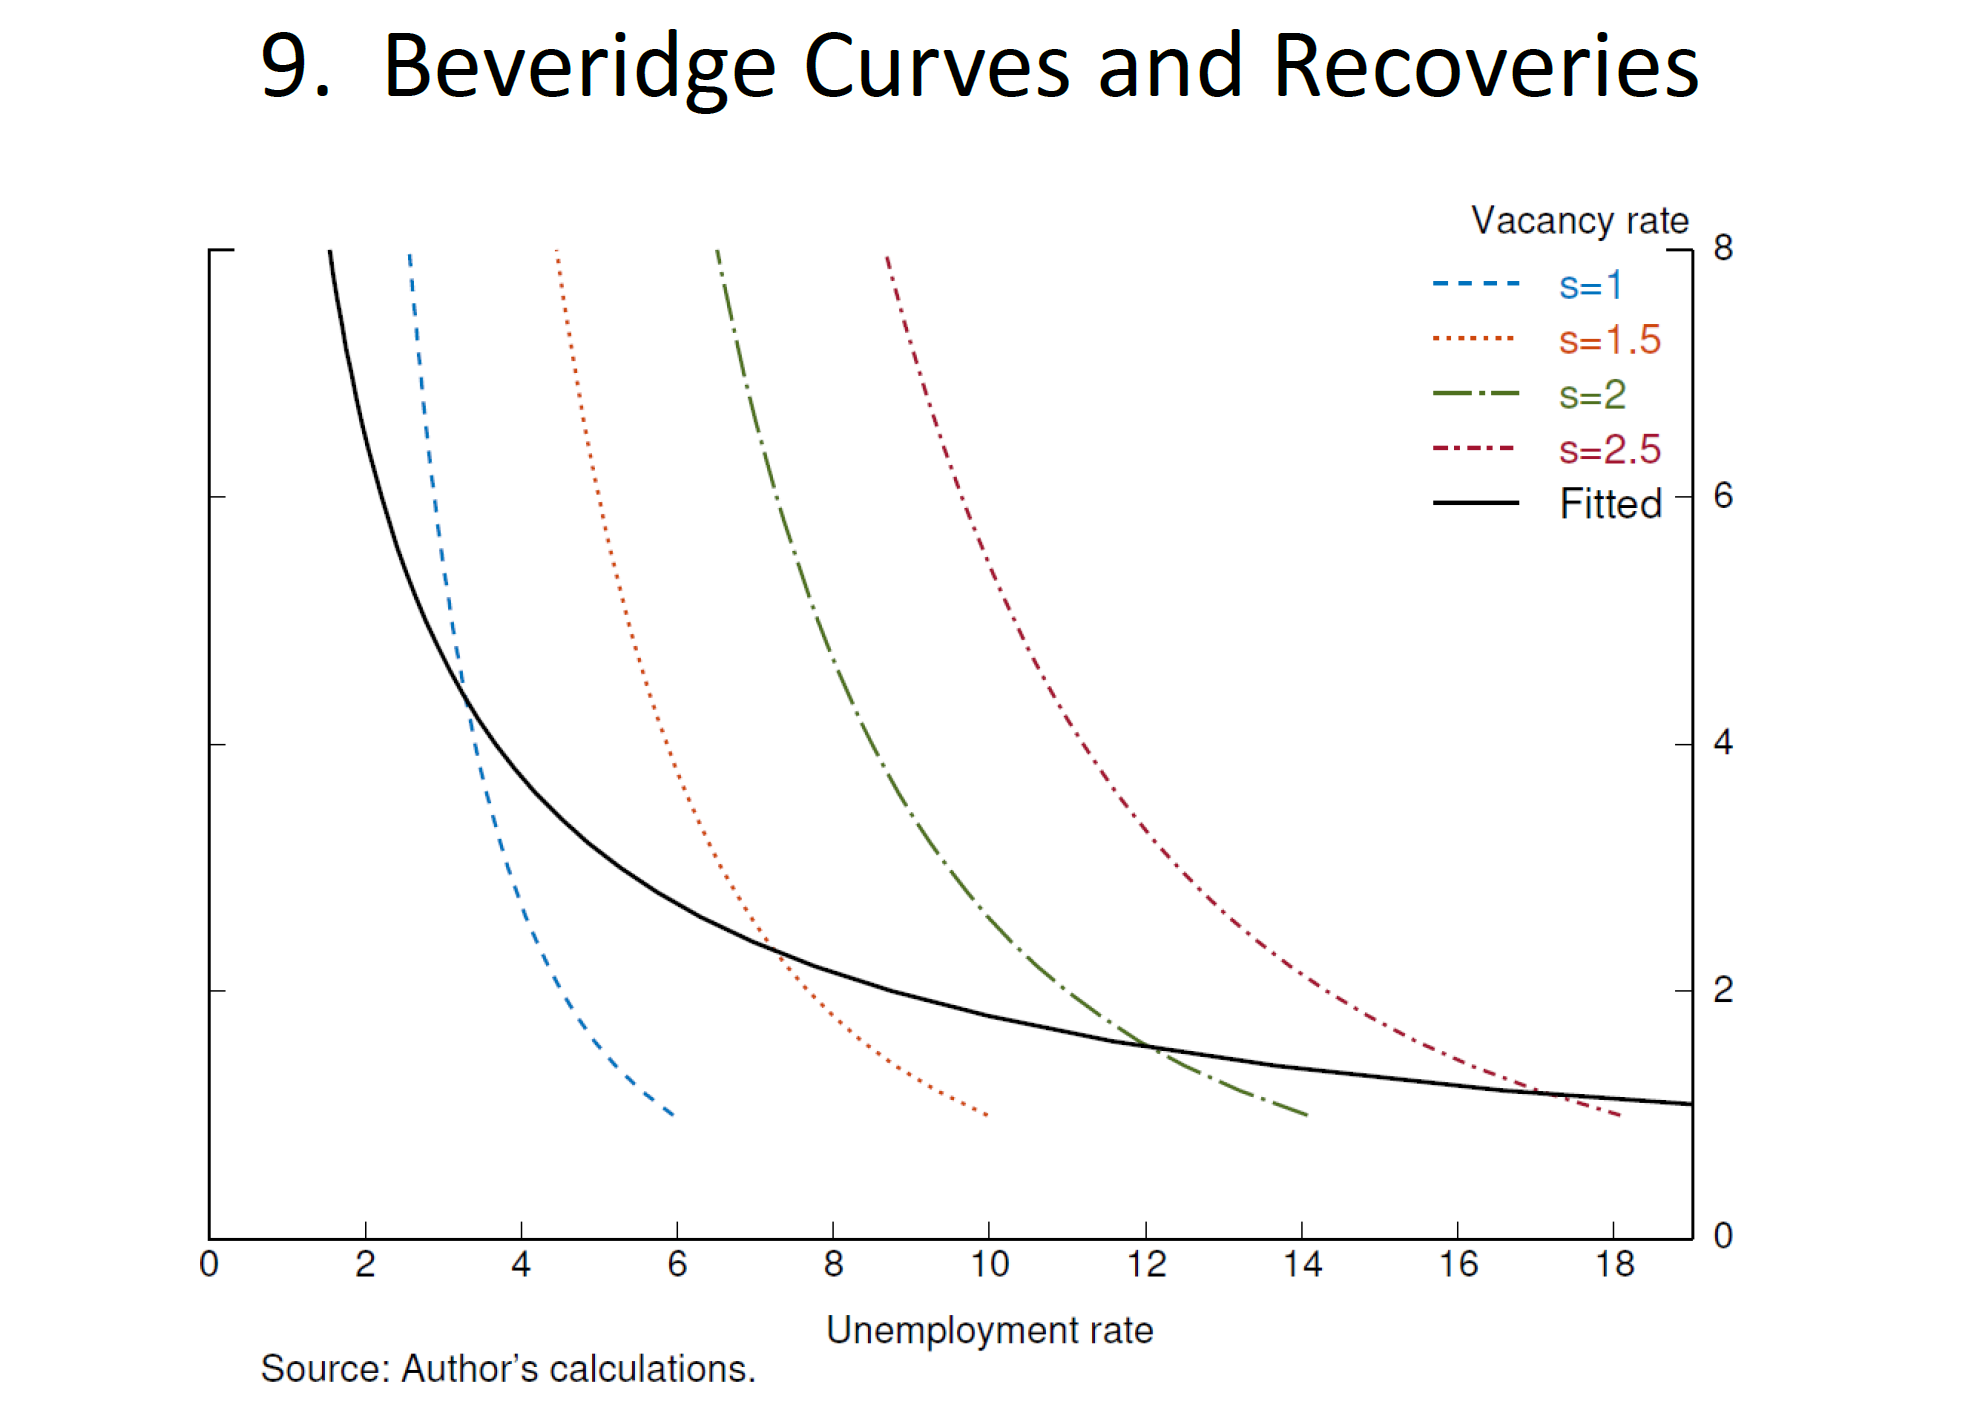
Now let's think about what happens as the economy recovers, as it has over the past two years. In an expansion, layoffs fall, pushing down separations and moving the curve to the left. At the same time, greater labor demand increases vacancies, causing the labor market to move up the steep curves. The combination of these movements is shown in slide 9 as the black fitted curve, which I've reproduced from slide 4. As you recall, the black curve fits the actual observations on unemployment and vacancies we saw before the pandemic. And we now can see that these observations are produced by a combination of changes in vacancies and separations (as well as other influences on unemployment). Decreases in the separations rate reduce the unemployment rate without changing vacancies, imparting a flatness to the fitted curve relative to the steeper curves that only reflect the effect of vacancies. If we want to just focus on the effect of vacancies, then we should be looking at the steep curves, especially when the labor market is tight, as it is now.
More Articles
- Federal Reserve: Financial Stability in Uncertain Times, A Speech by Governor Michelle W. Bowman
- Jerome Powell's Semiannual Monetary Policy Report; Strong Wage Growth; Inflation, Labor Market, Unemployment, Job Gains, 2 Percent Inflation
- February’s Hot Data Releases: Governor Christopher J. Waller, Federal Reserve Board Frames a Few of the Issues Around Inflation and the Economic Outlook
- Gender and Labor Markets by Diego Mendez-Carbajo* : "Sure [Fred Astaire] was great, but don't forget that Ginger Rogers did everything he did…backwards and in high heels." — Robert Thaves1
- The Federal Open Market Committee Statement: The Path of the Economy Continues to Depend On The Course Of The Virus
- Federal Reserve Chairman Jerome Powell: Monetary Policy in the Time of Covid
- Coronavirus Aid, Relief, and Economic Security Act; Chair Jerome H. Powell Before the Committee on Financial Services, House of Representatives
- Chair Jerome H. Powell: A Current Assessment of the Response to the Economic Fallout of this Historic Event
- Federal Reserve: Optimism in the Time of COVID; Businesses Seem Much Better Adapted to Remaining Open
- Federal Reserve Chair Jerome Powell Addresses Current Economic Issues: For Some, a Reversal of Economic Fortune