Women Consistently Earn Less Than Men; Women Are Over-represented in Lower Paying Jobs and, As They Age, the Pay Gap Widens Even More
By Earlene K.P. Dowell
The U.S. Census Bureau’s Quarterly Workforce Indicators (QWI) shows the pay and age dynamic of women and men. Here, we looked at workers ages 35-44.
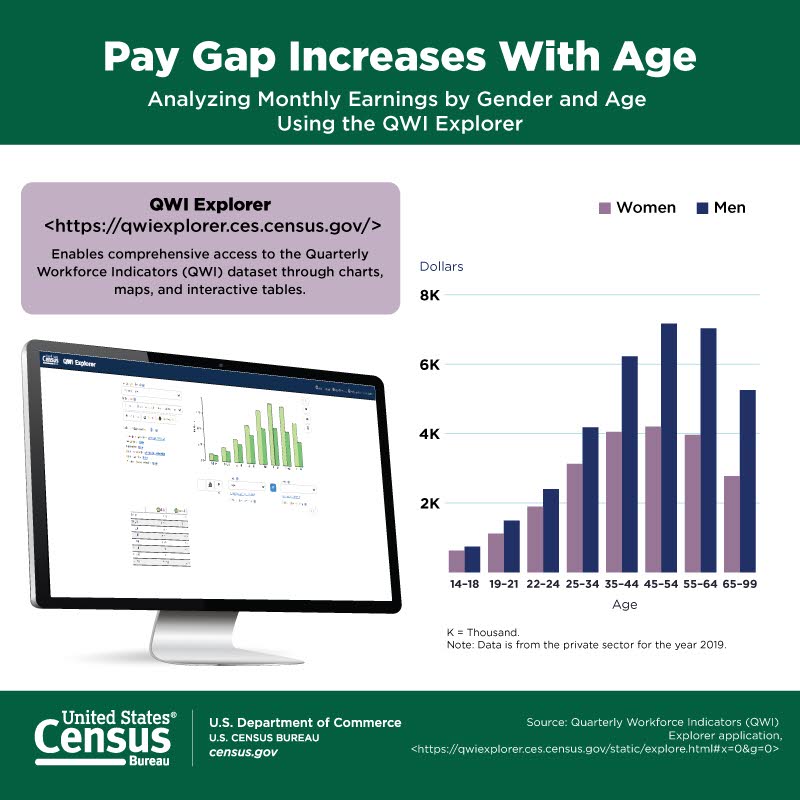
According to the QWI data based on unemployment insurance wage records for the third quarter of 2020 (the most recent national data), women in the United States earned 30% less than men and that pay gap increased with age.
The gender gap has narrowed for younger women as they increase their education level and break into occupations traditionally dominated by men.
Although the gender pay gap has narrowed since the signing of the Equal Pay Act of 1963, women earned 82 cents for every dollar a man earns according to 2020 data from the Bureau of Labor Statistics.
The gender gap has narrowed for younger women as they increase their education level and break into occupations traditionally dominated by men.
While women have a growing presence in higher paying industries like Information or Professional, Scientific, and Technical Services, they are still over-represented in lower paying industries.
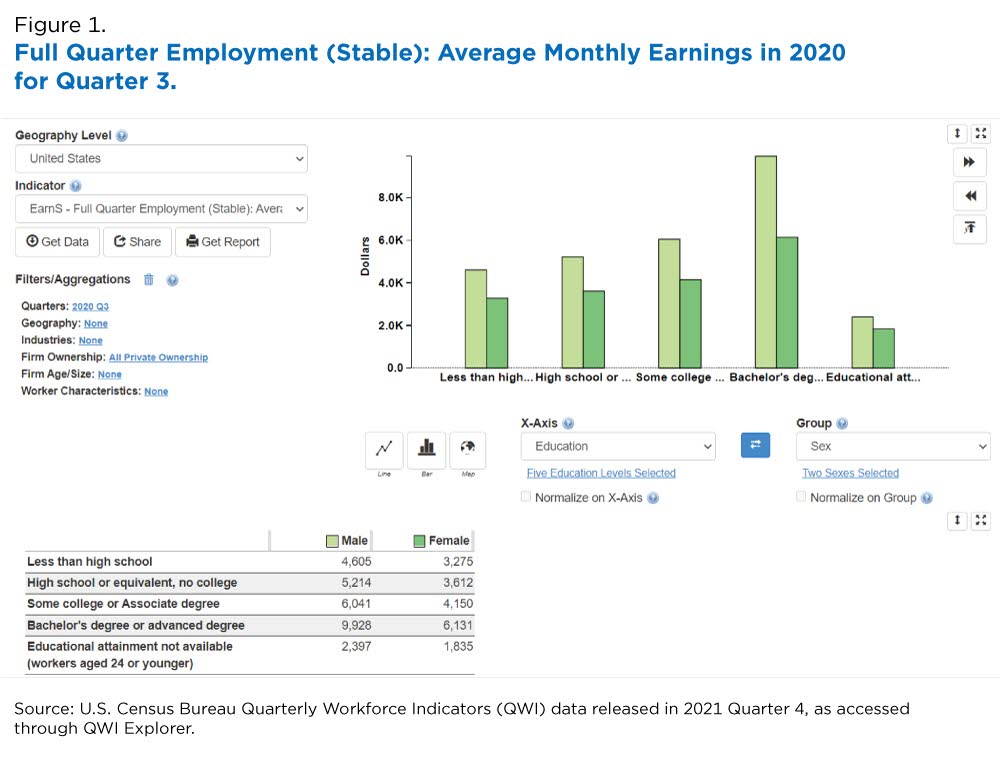
QWI Explorer provides easy access to national data on the earnings of women and men. Figure 1 shows a gap in monthly wages of almost $4,000 for women compared to men with a bachelor’s or advanced degree.
Women are more likely than men to be employed in professional and related occupations, according to a 2019 BLS report. Within the professional category, however, the proportion of women in higher-paying jobs is much smaller than that of men.
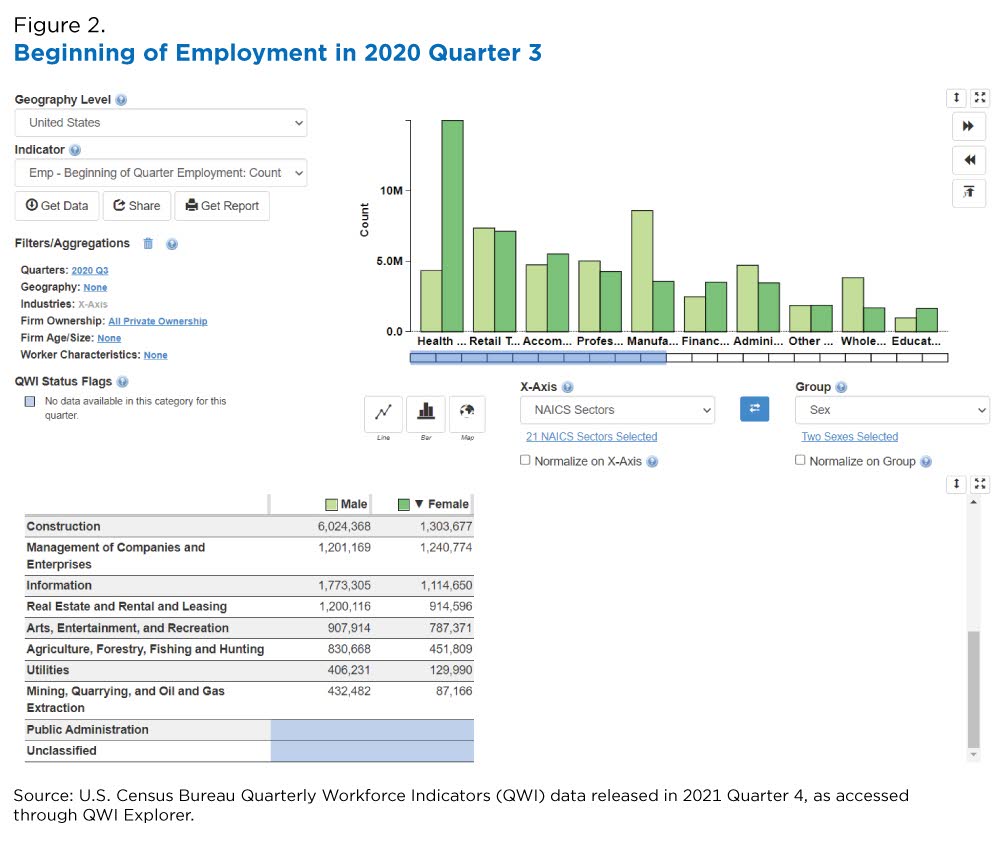
Figure 2 shows there are nearly 15 million women in Health Care and Social Services, over 7 million in Retail and Trade and 5.5 million in Accommodations and Food Services.
QWI Explorer
The QWI Explorer allows users to examine different aspects of the labor market through interactive tables that compare and rank labor force statistics on:
- Employment.
- Job creation and destruction.
- Wages.
- Hires and separations.
Through interactive visualizations and detailed reports, users can analyze earnings by worker sex, race, education, industry, and age across national, state, metro/micropolitan, and workforce investment areas.
An infographic published last year using 2019 data from the Longitudinal Employer-Household Dynamics (LEHD)’s Quarterly Workforce Indicators (QWI) Explorer illustrates the trend.
Pages: 1 · 2
More Articles
- Medicare Advantage Increasingly Popular With Seniors — But Not Hospitals and Doctors
- Julia Sneden Redux: Age Rage; Sometimes You Just Have to Strike Back
- Medical Billing and Collections Among Older Americans
- Shhhhhh by Ferida Wolff
- Rose Madeline Mula Writes: I’ve Got A Secret – NOT!
- Government of Canada Renews Investment in Largest Canadian Study on Aging
- Rose Madeline Mula Writes: I Feel Like That Carton of Milk In the Refrigerator Which Is Beyond Its Expiration Date
- Julia Sneden Writes: Age Rage; Sometimes You Just Have to Strike Back
- Once ADAS-trained, Older Adults Find It Easier to Access and Use Driver-assistance Technologies Without Compromising Their Attention to the Road
- Julia Sneden Writes: DisGRAYceful (A hair-raising tale)


