


As we follow through on our plan to move monetary policy to an appropriately restrictive stance, the effect of the increased policy rate and pace of balance sheet shrinkage should put downward pressure on aggregate demand, particularly in interest-sensitive sectors like housing. Continued improvements in supply conditions and a further rotation of consumption away from goods and into services should also help by reducing price pressures in goods. With regard to non-housing services, the magnitude of price pressure over the next several quarters will depend on an overall slowing in spending as well as the extent to which labor supply improves in these sectors.
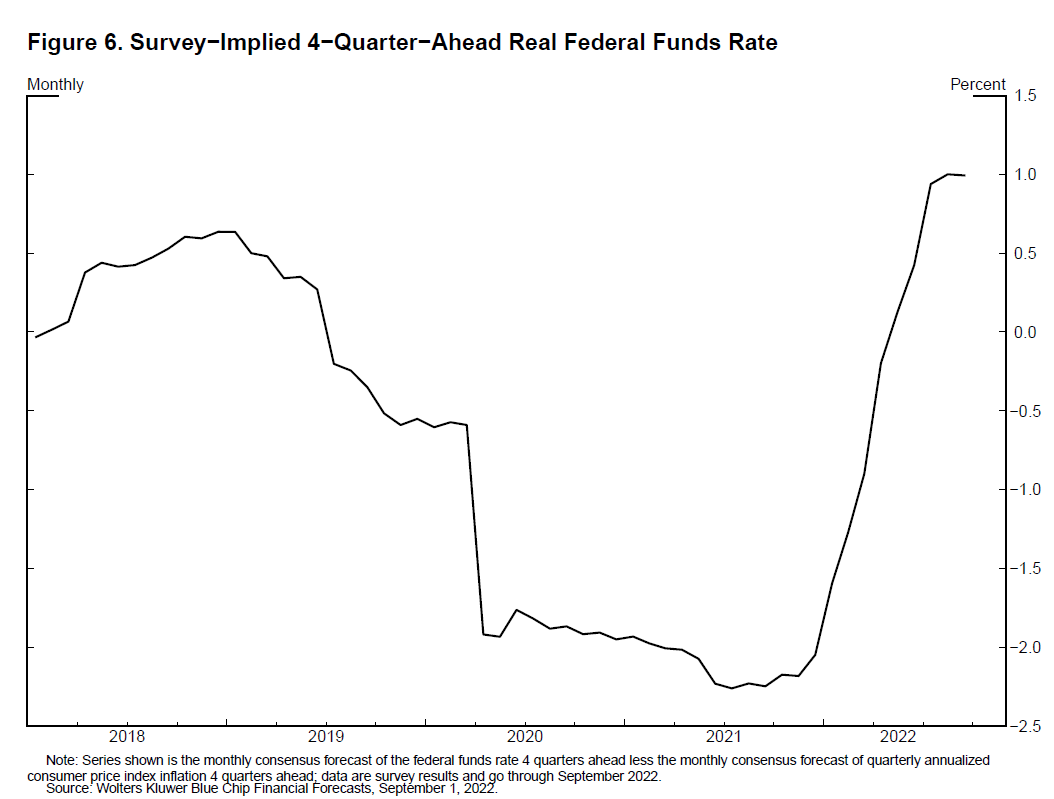
Since pivoting last year, our actions and communications have tightened financial conditions significantly and at a much more rapid speed than earlier cycles. So far during 2022, real 2-year yields have risen more than 350 basis points to about 1.2 percent, and 10-year real yields have risen almost 200 basis points and now stand at 0.85 percent—in the range of values for 10-year real yields from 2014 to 2018. The rapid tightening in monetary policy is also reflected in a significant increase in the projected real short rate: The Blue Chip Financial Forecasts has the expected short rate moving above 0.5 percent in real terms to a significantly higher level than pre-pandemic within the next 12 months (figure 6).
It may take some time for the full effect of these tighter financial conditions to work their way through the economy. The disinflationary process here at home should be reinforced by weaker demand and tightening in many other countries. This is particularly the case as Europe contends with downside risks to activity and a severe energy shortage caused by Russia's war against Ukraine, and as China maintains its zero-COVID approach against a backdrop of weaker consumption.
At some point in the tightening cycle, the risks will become more two-sided. The rapidity of the tightening cycle and its global nature, as well as the uncertainty around the pace at which the effects of tighter financial conditions are working their way through aggregate demand, create risks associated with overtightening. And if history is any guide, it is important to avoid the risk of pulling back too soon. Following a lengthy sequence of adverse supply shocks to goods, labor, and commodities that, in combination with strong demand, drove inflation to multidecade highs, we must maintain a risk-management posture to defend the inflation expectations anchor.9 While we have no control over the supply shocks to food, energy, labor, or semiconductors, we have both the capacity and the responsibility to maintain anchored inflation expectations and price stability.
We are in this for as long as it takes to get inflation down. So far, we have expeditiously raised the policy rate to the peak of the previous cycle, and the policy rate will need to rise further. As of this month, the maximum monthly reduction in the balance sheet will be nearly double the level of the previous cycle.10 Together, the increase in the policy rate and the reduction in the balance sheet should help bring demand into alignment with supply. Monetary policy will need to be restrictive for some time to provide confidence that inflation is moving down to target. The economic environment is highly uncertain, and the path of policy will be data dependent. While the precise course of action will depend on the evolution of the outlook, I am confident we will achieve a return to 2 percent inflation. Our resolve is firm, our goals are clear, and our tools are up to the task.
*Lael Brainard took office as the Vice Chair of the Board of Governors of the Federal Reserve System on May 23, 2022, for a four-year term. Dr. Brainard has served as a member of the Board of Governors of the Federal Reserve System since taking office on June 16, 2014, to fill an unexpired term ending January 31, 2026.
While serving on the Board, Dr. Brainard was appointed chair of the Financial Stability Board Standing Committee on Assessment of Vulnerabilities for a two-year term effective December 10, 2021, and chair of the Organization for Economic Co-operation and Development Working Party 3 effective July 1, 2019.
From 2009 through 2013, Dr. Brainard served as Under Secretary of the U.S. Department of the Treasury and counselor to the Secretary of the Treasury, where she received the Alexander Hamilton Award. During this time, she was the U.S. representative to the G-20 Finance Deputies and G-7 Deputies and was a member of the Financial Stability Board.
1. I am grateful to Kurt Lewis of the Federal Reserve Board for his assistance in preparing this text and to Kenneth Eva for preparing the figures. These views are my own and do not necessarily reflect those of the Federal Reserve Board or the Federal Open Market Committee. Return to text
2. For comparison, growth in the alternative activity measure of real gross domestic income (GDI) has come in just below potential in the first half of the year. The national income and product accounts contain two measures of total economic output, measured through an expenditure approach, reported as more-familiar GDP, or an income approach, reported as GDI. These two series generally track each other fairly closely, but research indicates that some independent information about the business cycle can be found in each of the series. The gap between the levels of GDP and GDI, known as the statistical discrepancy, was over $750 billion in the second quarter, by far its largest historical size. For a discussion of these series and the business cycle, see Jeremy J. Nalewaik (2010), "The Income- and Expenditure-Side Estimates of U.S. Output Growth," (PDF) Brookings Papers on Economic Activity, Spring, pp. 71–106. Return to text
3. For more details on this difference and further information on how the effect of inflation varies across households, see Lael Brainard (2022), "Variation in the Inflation Experiences of Households," speech delivered at the Spring 2022 Institute Research Conference, Opportunity and Inclusive Growth Institute, Federal Reserve Bank of Minneapolis, Minneapolis, April 5. Return to text
4. For more information, see https://gasprices.aaa.com. Return to text
5. See, for example, Kim Chipman and Tarso Veloso Ribeiro (2022), "Dried-Out Farms from China to Iowa Will Pressure Food Prices," Bloomberg, August 27. Return to text
6. Price increases for nondurable goods moderated, and price declines in used vehicles as well as durable goods other than motor vehicles more than offset further increases in the prices of new cars and trucks. Prices for PCE services excluding energy and housing declined 0.1 percent in July, the first price decline in this category since November 2020. Return to text
7. After-tax profits in the nonfinancial corporate sector, adjusted for inventory valuation and capital consumption and expressed as a fraction of nominal GDP, were 13 percent in the second quarter. This is just slightly lower than the series high since 1947 of 13.5 percent, set in the second quarter of 2021. Return to text
8. The debate in this area can be seen in two recent pieces. See Andrew Figura and Chris Waller (2022), "What Does the Beveridge Curve Tell Us about the Likelihood of a Soft Landing?" FEDS Notes (Washington: Board of Governors of the Federal Reserve System, July 29); and Olivier Blanchard, Alex Domash, and Lawrence H. Summers (2022), "Bad News for the Fed from the Beveridge Space," Peterson Institute for International Economics, Policy Brief 22-7 (Washington: PIIE, July), https://www.piie.com/sites/default/files/documents/pb22-7.pdf. Return to text
9. See Ricardo Reis (2022), "The Burst of High Inflation in 2021–22: How and Why Did We Get Here?" working paper. Return to text
10. As of September 2022, the monthly caps on the runoff of Treasury securities and mortgage-backed securities are $60 billion and $35 billion per month, as compared with $30 billion and $20 billion, respectively, from 2017 to 2019. Return to text