


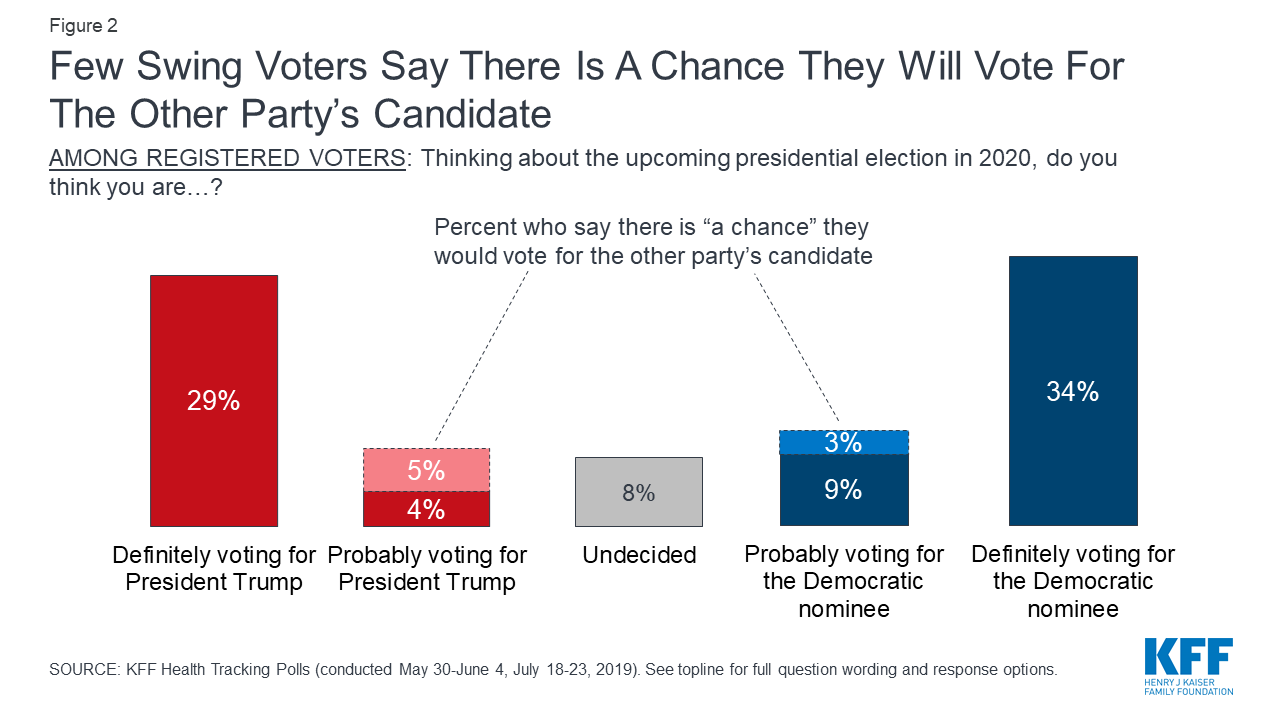
Figure 2: Few Swing Voters Say There Is A Chance They Will Vote For The Other Party’s Candidate
A vast majority of Democratic voters (85%) and most Republican voters (70%) say they aren’t going to cast a vote for the other party’s candidate. Seven in ten voters who identify as Democrats or Democratic-leaning independents say they are “definitely” going to vote for the Democratic nominee and an additional 16% say they are “probably” going to vote for the Democratic nominee and there is “no chance” they will vote for President Trump. On the other side of the aisle, six in ten Republican and Republican-leaning voters say they will “definitely” vote for President Trump with an additional 9% saying they are “probably” going to vote for President Trump and there is “no chance” they will vote for the Democratic nominee.
|
Table 1: Few Voters On Either Side Of Political Aisle Say There Is A Chance They Would Vote For The Other Party’s Candidate |
||||
|
|
Total voters |
Democratic/ Democratic-leaning voters |
Pure independent voters |
Republican and Republican-leaning voters |
|
Definitely voting for President Trump |
29% |
3% |
11% |
61% |
|
Probably going to vote for President Trump |
9 |
1 |
11 |
18 |
|
A chance they will vote for the Democratic nominee |
5 |
1 |
8 |
9 |
|
No chance they will vote for the Democratic nominee |
4 |
* |
3 |
9 |
|
Probably going to vote for the Democratic nominee |
13 |
20 |
11 |
6 |
|
A chance they will vote for President Trump |
3 |
4 |
2 |
3 |
|
No chance they will vote for President Trump |
9 |
16 |
8 |
3 |
|
Definitely voting for the Democratic nominee |
34 |
69 |
13 |
3 |
|
Undecided (Vol.) |
8 |
4 |
29 |
7 |
Instead of voting for the other party’s candidate, some of the voters who are leaning towards a candidate but haven’t made up their minds yet may choose to not vote in the 2020 presidential election. Nearly one-fourth of swing voters say they didn’t vote in either the 2016 presidential election (24%) or in the 2018 election (22%). A slightly larger share of Democrat swing voters (33%) say they didn’t vote in the 2016 election than both independents (23%) or Republicans (21%).
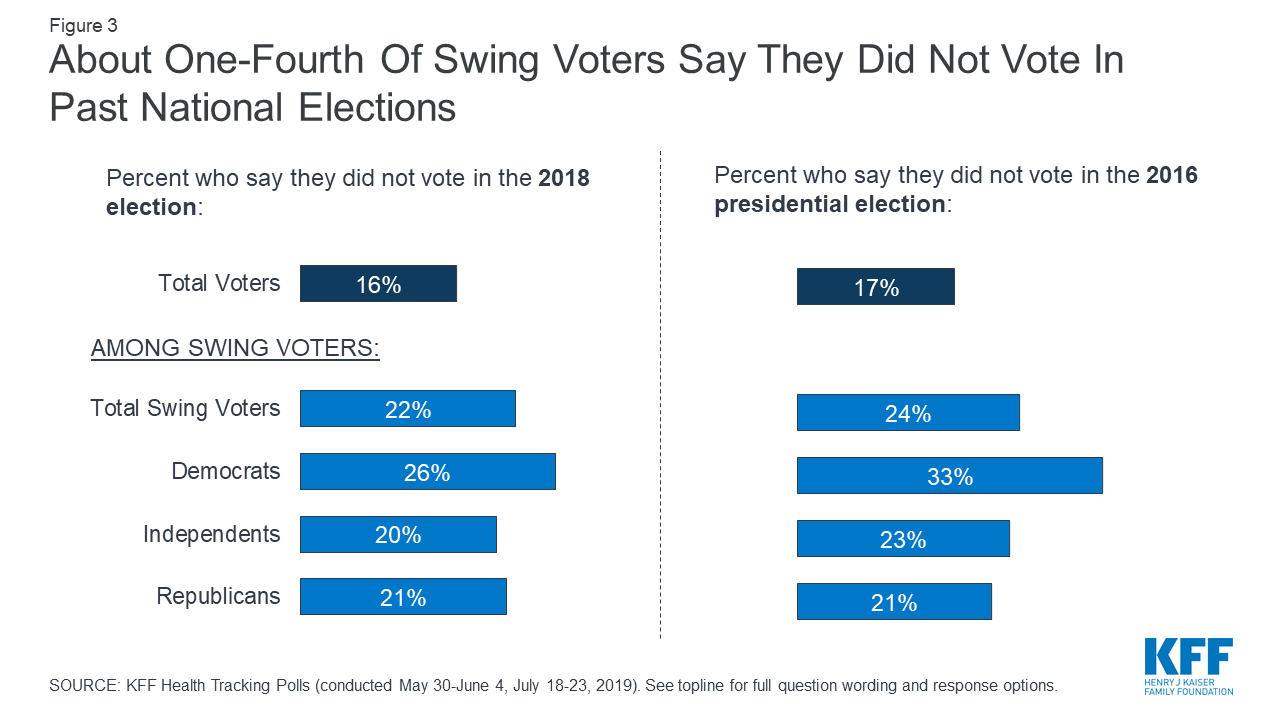
Figure 3: About One-Fourth Of Swing Voters Say They Did Not Vote In Past National Elections
Decided Voters v. Swing Voters
On most demographics, swing voters look very similar to their counterparts (voters who say they have already decided who they are going to vote for in the 2020 election), but they differ on three key variables: age, party identification, and ideology. To see a complete demographic profile of swing voters, see the appendices.
Age
When we look at the share of demographic groups who get classified as either “swing voters” or “decide voters,” we find that about three in ten – across all socioeconomic groups such as gender, education, and urbanicity – are classified as swing voters. This is not true among the different age groups. A larger share of voters between 18 and 29 years old are “swing voters” (44%) which is nearly identical to the share of this group who are “decided voters.”
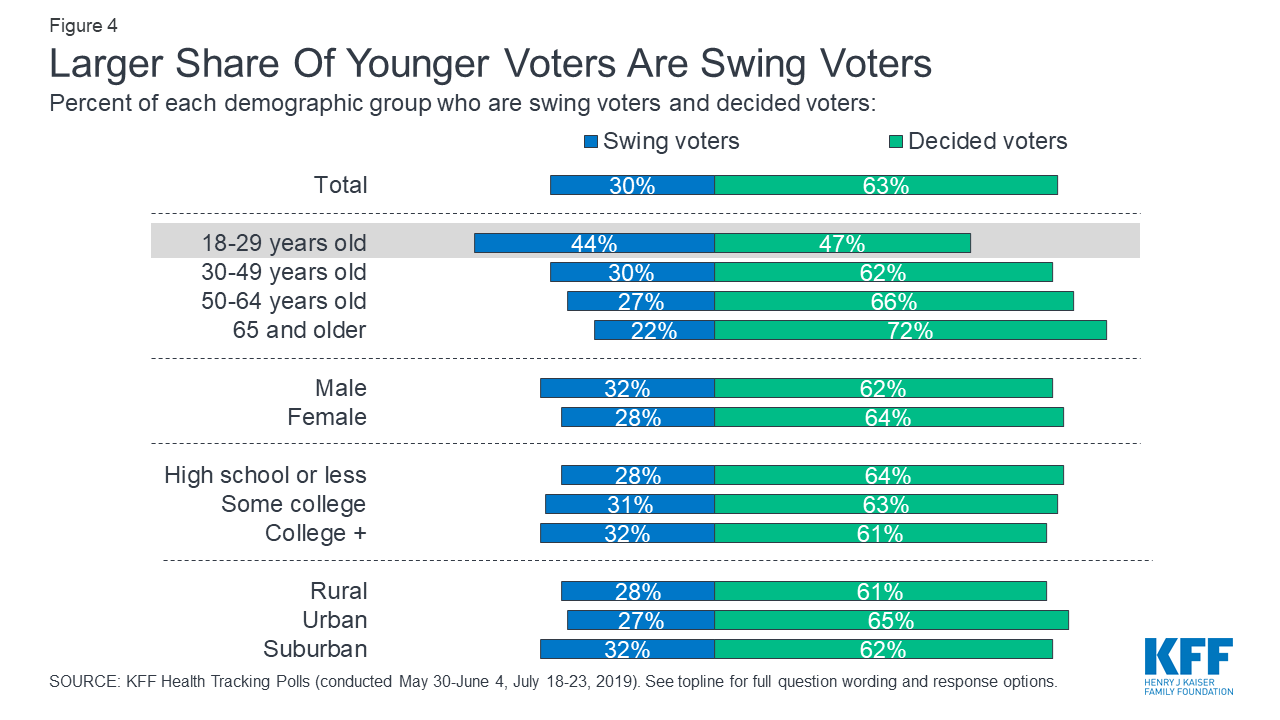
Figure 4: Larger Share Of Younger Voters Are Swing Voters
More Articles
- Jo Freeman Writes: The 2024 Libertarian National Convention as Seen Through Feminist Eyes
- Jo Freeman Writes: Kennedy vs. Trump at the Libertarian National Convention
- Board of Governors of the Federal Reserve System: Something’s Got to Give by Governor Christopher J. Waller
- February’s Hot Data Releases: Governor Christopher J. Waller, Federal Reserve Board Frames a Few of the Issues Around Inflation and the Economic Outlook
- Looking Back: Women's Congressional Policy Institute, Weekly Legislative Update; September 12-16, 2022, Screening Initiatives by Health Care and Social Service Providers
- Remarks by President Biden on American Rescue Plan Investments; September 02, 2022, South Court Auditorium Eisenhower Executive Office Building
- VA Disability: Clearer Claims Processing Guidance Needed for Selected Agent Orange Conditions, Publicly Released: Sep 01, 2022
- Ferida's Wolff's Backyard: Geese Coming Home
- Jo Freeman Reviews Russell Lee: A Photographer's Life and Legacy
- The US Housing and Mortgage Market, Risks and Resilience: Federal Reserve Governor Michelle W. Bowman