


II. Implications for Income and Net Worth
All of these considerations are useful context for changes in income and wealth between the 2019 and 2022 surveys. In particular, growth in mean income (measured for the calendar year before the survey, so 2018 and 2021, respectively, for the most recent two surveys) was generally either absent or more modest among lower-income and less-educated families and very strong at the top, resembling the distribution of pandemic experiences over income and education.16 These differences are even more pronounced when excluding unemployment benefits, which, in their exceptional generosity over this period, buoyed income growth among lower income families.17 At the extreme is families in the second usual income quintile, among whom unemployment benefits added over 2 percentage points to mean income growth, explaining nearly half of it.
Indeed, mean income was lower for families that reduced their employment, non-teleworking families, and families that experienced either type of severe COVID-19 infection (figure 1, left bars).18 That said, as table 1 shows, families in these groups were more concentrated in the bottom segments of the usual income distribution, warranting a more granular analysis. Within each income group, mean income remained lower for families whose employment decreased relative to families in the baseline employment group—those whose employment did not change—as well as families whose employment increased and for non-teleworking families relative to teleworking families, but the differences were much more modest than the overall figures (figure 1, right bars).19 Mean income was also generally, but not always, lower for families that experienced a severe COVID-19 infection, which could suggest health shocks transmitted to income primarily through the employment channel.20
Figure 1. Mean Income across Pandemic Experiences, by Usual Income Group
2022 dollars
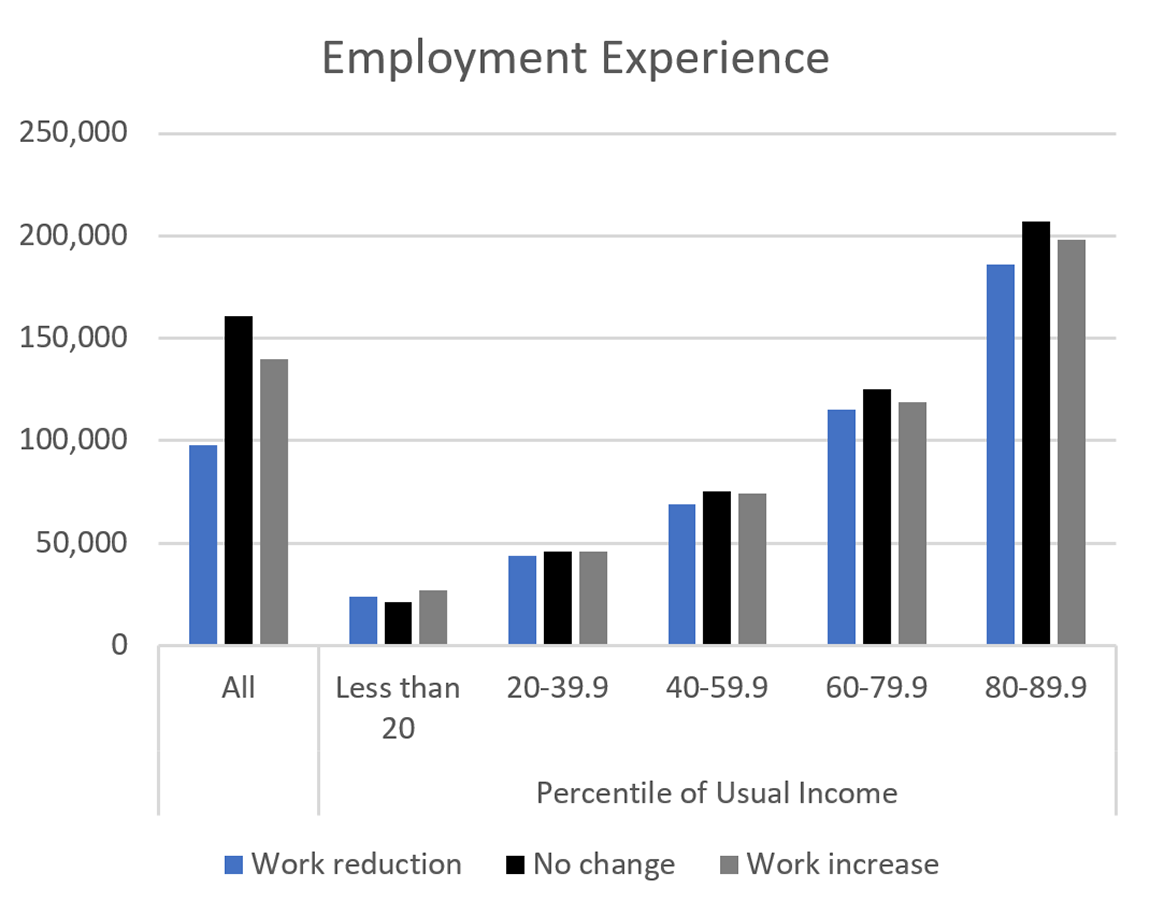
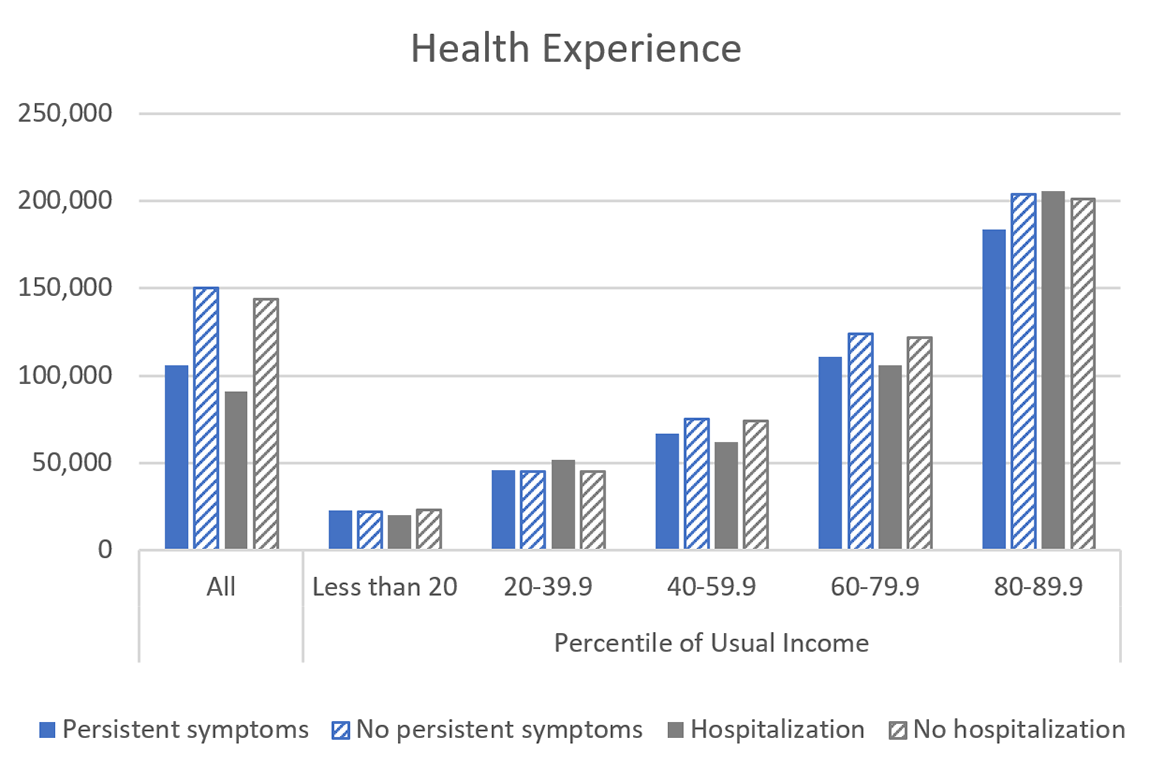
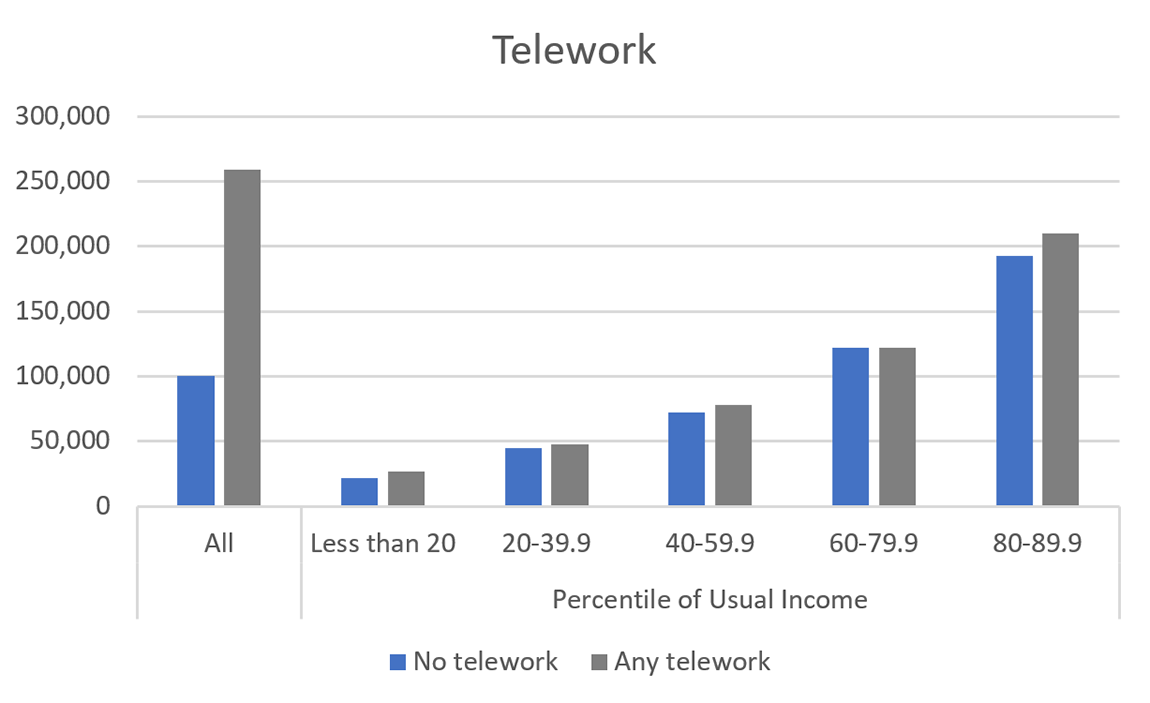
Note: The key in each panel identifies series in order from left to right. All families are included in the "all" category, but for illustrative purposes, the figures do not separately present the top decile. COVID-19 question categories are defined for the Survey of Consumer Finances (SCF) respondent (and their spouse or partner, if applicable). Employment experience classifications use the first response to the employment status question from each person. "No change" in employment refers to either no change or the small percentage of families (less than 2 percent of families in each grouping we consider) that reported both a reduction and increase across spouses or partners. Hospitalization and persistent symptoms are not mutually exclusive categories. Telework leverages the full menu of possible responses to employment status (as opposed to just the first response). Income is measured for the calendar year before the survey.
Compared with growth in mean income, growth in mean net worth (measured at the time of the survey) over the income distribution follows more of an inverse-U shape and, in most instances, far exceeded growth in income (table 1, bottom panel). These patterns primarily reflect sizable increases in house and equity prices between 2019 and 2022, assets that are generally not held by families in the bottom quintile of the income distribution and that are relatively less important to those in the top decile. Asset price appreciation, along with generous early stimulus measures, buffered families' balance sheets from the shocks that they differentially experienced and, for some groups, also helped strengthen them relative to 2019. While it is unclear whether the improvement in balance sheets between 2019 and 2022 will sustain, particularly given that families that were more likely to experience pandemic-related setbacks had weaker income growth, just over 90 percent of families that experienced a reduction in work over the pandemic were employed at the time of the 2022 SCF interview.21
Mean net worth, like mean income, was lower for families that reduced their employment, non-teleworking families, and families that experienced either type of severe COVID-19 infection (figure 2). Some of these relationships appear to be more heavily influenced by the distribution of employment changes and telework status across usual income groups: across income groups, families whose employment decreased and non-teleworking families often had higher net worth, on average, than those that increased their employment and those that teleworked.22 That said, as in the overall figures, mean net worth among families whose employment decreased, by income group, was consistently below that of families in the baseline employment group. Notably, the difference between these two groups is largest in the bottom quintile, where families whose employment decreased had just over one-half the mean net worth of families whose employment did not change. In all other income groups, families whose employment decreased had about two-thirds or more of the mean net worth of families whose employment did not change. With respect to health status, across all income groups, families that experienced a severe infection, on average, had lower net worth than families that did not, with larger differences throughout the distribution for the measure based on persistent symptoms than for the one based on hospitalization.23 On balance, the evidence appears to suggest that families that experienced pandemic-related shocks had, on average, less financial cushion in 2022 than their peers (potentially due to drawing down their reserves over the pandemic) but that even for these families, a fair amount of cushion was available.