


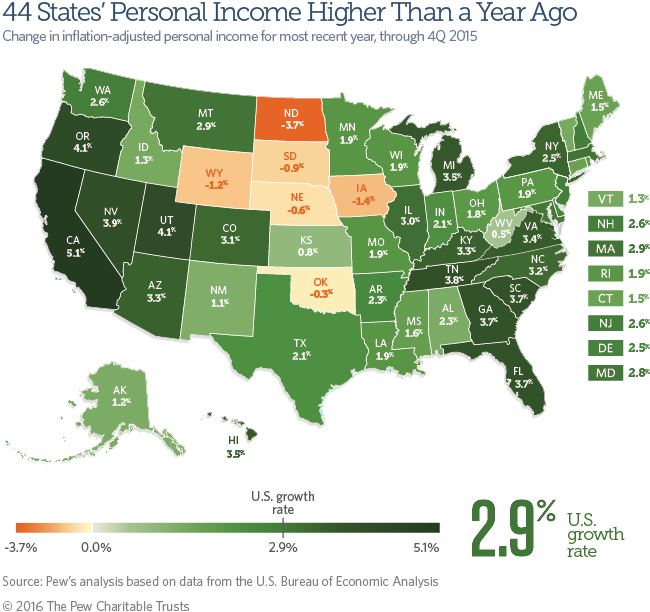
Trends in personal income for the fourth quarter of 2015, adjusted for inflation and compared with a year earlier:
- The fastest growth rates in the fourth quarter of 2015 relative to a year earlier were in a cluster of Western states: California (5.1 percent), Oregon (4.1 percent), Utah (4.1 percent), and Nevada (3.9 percent).
- Among the six states with a drop in personal income, North Dakota (-3.7 percent) and Wyoming (-1.2 percent) were hurt primarily by declining earnings in the mining industry, which includes coal, natural gas, and oil production. Iowa (-1.4 percent), South Dakota (-0.9 percent), and Nebraska (-0.6 percent) mainly registered losses in the farm sector, and Oklahoma (-0.3 percent) saw declines in farming, mining, and manufacturing income.
- Although 44 states registered gains, personal income in two grew by less than 1 percent: West Virginia (0.5 percent) and Kansas (0.8 percent). Farm earnings fell in Kansas, and the mining industry stunted West Virginia’s growth.
- At the end of 2015, nine states saw growth in personal income that the Bureau of Economic Analysis attributed to bonuses paid when auto workers ratified new union contracts: Illinois, Indiana, Kansas, Kentucky, Missouri, Michigan, Ohio, Tennessee, and Texas.
Personal income in 38 states grew faster between the fourth quarters of 2014 and 2015 than its constant pace since the end of 2007, accelerating those states' economic expansions. In six states — Alaska, Idaho, Kansas, New Mexico, Texas, and West Virginia — personal income increased in the past year but did so at a slower pace than each state’s constant growth rate since the recession, moderating their growth trends. Among the six states with declines over the past year, North Dakota had the largest drop but still enjoyed the greatest growth within the US for inflation-adjusted personal income since the recession's onset.
By other measures, states’ recovery from the recession also is uneven. According to Pew's Fiscal 50 research, 21 states still were collecting less tax revenue, after adjusting for inflation, in the second quarter of 2015 than at their individual peaks before or during the recession. Meanwhile, employment measures show that many states’ labor markets have yet to completely recover.
Some ups and downs since recession
The constant rate of growth between 2007 and 2015 masks volatility in personal income that occurred in intervening calendar years. (See the "Year by year" tab for annual results in each state between 2007 and 2015. Because year-by-year results are based on changes in total dollars of personal income from calendar year to calendar year, those results cannot be compared with growth rates in the 50-state chart that measure changes in annualized fourth-quarter data from a year-earlier period.)
Measuring total dollars of personal income received in each calendar year, this economic gauge fell in every state in 2009. The country rebounded over the next three years: 49 states’ personal income rose in 2010 — Nevada was the outlier — and all states saw increases in 2011 and 2012. In 2013, personal income fell in 39 states, reflecting a number of taxpayers shifting income to 2012 from 2013 to avoid potential increases in certain federal tax rates, and the expiration of other tax rates. The rebound resumed over the next two years, with personal income rising in every state but Kansas in 2014. For calendar 2015, personal income was higher than in 2014 in all but three states: Iowa, North Dakota, and South Dakota.
What is personal income?
Personal income tallies residents' paychecks, Social Security benefits, employers' contributions to retirement plans and health insurance, income from rent and other property, and benefits from public assistance programs such as Medicare and Medicaid, among other items.
Federal officials use state personal income to determine how to allocate support to states for certain programs, including funds for Medicaid. State governments use personal income statistics to project tax revenue, set spending limits, and estimate the need for public services.
Looking at personal income per capita or state gross domestic product, which measures the value of all goods and services produced within a state’s borders, can yield different insights on state economies.
Download the data to see state-by-state growth rates for personal income from 2007 through the fourth quarter of 2015. Visit The Pew Charitable Trusts' interactive resource, Fiscal 50: State Trends and Analysis, to sort and analyze data for other indicators of state fiscal health.
Analysis by Alex Boucher, Ruth Mantell, and Jennifer Thornton
Pages: 1 · 2
More Articles
- November 1, 2023 Chair Jerome Powell’s Press Conference on Employment and Inflation
- Journalist's Resource: Religious Exemptions and Required Vaccines; Examining the Research
- Scientific American Endorses Joe Biden We’ve never backed a presidential candidate in our 175-year history — until now
- Stateline: Search and Rescue Teams, Already Stretched Thin, See Surge in Calls
- Stateline: Many Faithful Say It’s Time to Gather. Some Governors Disagree
- Pew Trust's Stateline: Staffing Nursing Homes Was Hard Before the Pandemic. Now It’s Even Tougher.
- Balloon Bombs and Blackouts in World War II; For Some a Familiar Time of Anxiety; Growing Up in the Second World War From England's Imperial War Museum
- Automatic Stabilizers: What Are They and Do They Help Workers Who Stay Home Due to the Corona Virus?
- Being forced to engage in any activity where you cannot leave is illegal. This includes: commercial sex, housework, farm work, construction, factory, retail, restaurant work, or any other activity
- Weekly National Summary of Week 50: Outpatient Illness Surveillance, Geographic Spread, Mortality Surveillance