


Flu Predictions From Columbia's Mailman School of Health & the CDC ... The Season Is Upon Us
Editor's Note: ILI means influenza-like illness; new predictions are posted every Friday afternoon during the flu season at Columbia University's site.
Infectious disease experts at Columbia’s Mailman School of Public Health launched a website over a year ago that reports weekly predictions for rates of season influenza in 94 cities in the United States based on a scientifically validated system. The URL to the influenza map is http://cpid.iri.columbia.edu/flu.html
Image from CDC
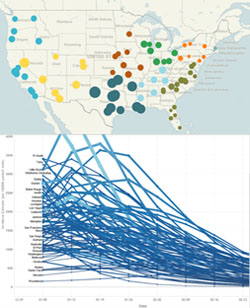
The page shows the weekly ILI+ reported so far in the 14-15 season. Use the 'Select week:' slider to select a different week and 'Select strain' option panel to specify strain. The larger map shows ILI observations in select cities and the smaller panel at the lower left shows the state-level observations. Hover on a bubble (for cities) or region (for states) to see the observed counts.
For Columbia's ILI+ forecasts for the remainder of the season, see 'Forecasts' tab. Use the option boxes on the right to select influenza strain and geographical location. The top panel shows forecasts for the selected strain and location; the lower panel shows the reported ILI+ for the same strain/location combination for the last four seasons.
Website Features
- Interactive map of the United States the displays the relative severity of seasonal flu in cities across the country flu and incidence numbers for each.
- Influenza incidence predictions by city for the coming weeks.
- Map that illustrates the proportion of flu cases by region.
- Charts that compare the timing and severity of the four most recent flu seasons.
- Exportable data for each week of the flu season.
"Flu forecasting is a powerful example of how public health research is leveraging technology to prevent the spread of infections and safeguard our health," says Linda P. Fried, MD, MPH, Dean of Columbia's Mailman School.
CDC's Weekly US Map: Influenza Summary Update is A Weekly Influenza Surveillance Report Prepared by the Influenza Division; the URL for this map is: http://www.cdc.gov/flu/weekly/usmap.htm
Chart and map from Columbia's Mailman School
The flu forecasting system adapts techniques used in modern weather prediction to turn real-time, Web-based estimates of influenza infection into local forecasts of the future influenza incidence by locality.
For the public, the flu forecast may promote greater vaccination, the exercise of care around people sneezing and coughing, and a better awareness of personal health. For health officials, it could inform decisions on how to stockpile and distribute vaccines and antiviral drugs, and in the case of a virulent outbreak, whether other measures, like closing schools, are necessary.
In the US the Centers for Disease Control estimates that between 3,000 and 49,000 die from the flu every year, according to the CDC.
More Articles
- National Institutes of Health: Common Misconceptions About Vitamins and Minerals
- A Yale Medicine Doctor Explains How Naloxone, a Medication That Reverses an Opioid Overdose, Works
- Kaiser Health News Research Roundup: Pan-Coronavirus Vaccine; Long Covid; Supplemental Vitamin D; Cell Movement
- How They Did It: Tampa Bay Times Reporters Expose High Airborne Lead Levels at Florida Recycling Factory
- A Scout Report Selection: Science-Based Medicine
- Journalist's Resource: Religious Exemptions and Required Vaccines; Examining the Research
- Government of Canada Renews Investment in Largest Canadian Study on Aging
- Kaiser Health News: Paying Billions for Controversial Alzheimer’s Drug? How About Funding This Instead?
- Medicare Covers FDA-approved COVID-19 Vaccines; You Pay Nothing For the COVID-19 Vaccine
- Envision Color: Activity Patterns in the Brain are Specific to the Color You See; NIH Research Findings Reveal New Aspects of Visual Processing